Is the volatility spike over — or just...
October 13, 2014
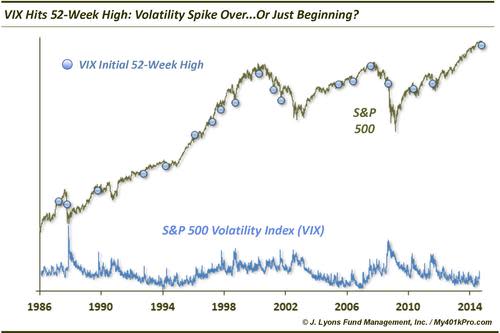
The question on everyone’s minds now is whether the recent volatility spike has about run its course or if it’s a sign of a shift in the market environment. A historical look at other times when the VIX made a new 52-week high for the first time in at least 6 months doesn’t immediately clear things up. Here are the drawdowns (i.e., max losses) going forward in the S&P 500 after such new highs in the VIX.
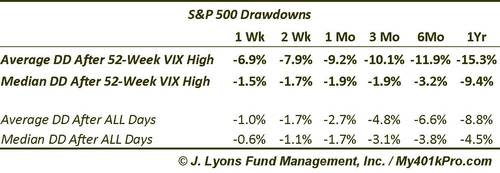
A look at the drawdowns reveals a couple things. The average drawdown after 52-week highs in the VIX are much greater than the norm. However, the median drawdowns are mostly in line with the norm. What does this tell us? It suggests that more times than not, a 52-week high in the VIX is more reflective of extreme fear levels associated with a near-term market bottom. It also suggests, however, that on occasion, the new VIX high has been a warning sign of impending bigger losses. Therefore, we cannot analyze these 52-week VIX highs in a vaccuum.
A number of times when the VIX made a 52-week high, the S&P 500 bottomed almost immediately and went on to sizable intermediate-term gains. These dates include October 1997, October 1998, March 2001 and September 2001. These instances mostly occurred after more significant weakness than we’ve seen so far, in the S&P 500 anyway. The VIX was also significantly higher on those dates. In fact, it was at least 40 in each of those instances, double what it is today.
A few times the 52-week high in the VIX occurred during or just prior to waterfall-type declines such as in October 1987, September 2008 and August 2011. While the market may be in transition to more challenging times, it does not yet have the hallmarks of that type of a crash environment.
The remaining dates led to mostly nondescript returns going forward, in the short-term and intermediate-term. Many of them had other characteristics possibly similar to our present case. That is, a new 52-week high in the VIX, but coming from a low level. Such (perhaps) similar precedents include October 1989, March 1994, April 2000 and July 2007. One common thread among those dates is that they occurred during a period of transition from a low volatility environment to a higher volatility environment. The first two transitions led to higher volatility periods that were relatively short-lived, i.e., less than a year. The other two, of course, led to longer, more serious cyclical downturns.
While it is way too soon yet to determine the significance and ramifications of the current spike in volatility, historical precedents can give us a clue as to the more likely meaning behind it. An examination of those precedents yields the conclusions that we are likely neither at a launch point of a substantial rally nor at risk of an imminent crash-type move. Current conditions do suggest that we are perhaps entering a transition from the recent low-volatility period to a higher-volatility period, with the length and difficulty of such a period is yet to be determined.
________
More from Dana Lyons, JLFMI and My401kPro.
Search
RECENT PRESS RELEASES
Related Post


